Municipals were steady to slightly firmer in spots while Connecticut priced for institutions with yields lowered from Monday’s retail offering. U.S. Treasury yields fell and equities made more gains.
The two-year muni-to-Treasury ratio Tuesday was at 58%, the three-year at 58%, the five-year at 59%, the 10-year at 59% and the 30-year at 87%, according to Refinitiv Municipal Market Data’s 3 p.m., ET, read. ICE Data Services had the two-year at 58%, the three-year at 57%, the five-year at 58%, the 10-year at 60% and the 30-year at 86% at 4 p.m.
In the primary market Tuesday, Jefferies priced and repriced for institutions with bumps from Monday’s retail offering $826.34 million of general obligation bonds for Connecticut (Aa3/AA-/AA-/AA+). The first tranche, $400 million of GOs, 2024 Series A, saw 5s of 1/2025 at 2.71% (+3), 5s of 2028 at 2.43% (-2), 5s of 2033 at 2.48% (-2) and 5s of 2037 at 2.87% (-7), callable 1/15/2034.
The second tranche, $250 million of social GOs, 2024 Series B, saw 5s of 1/2038 at 2.96% (-10), 4s of 2043 at 3.71% (-3), callable 1/15/2034.
The third tranche, $176.340 million of social refunding GOs, 2024 Series C, saw 5s of 1/2025 at 2.59% (-7), 5s of 2028 at 2.43% (-2) and 5s of 2033 at 2.48% (-2) and 5s of 2034 at 2.53%, noncall.
While muni yields only fell a few basis points in some places, depending on the scale, the November rally may continue, said Anders S. Persson, Nuveen’s chief investment officer for global fixed income, and Daniel J. Close, Nuveen’s head of municipals.
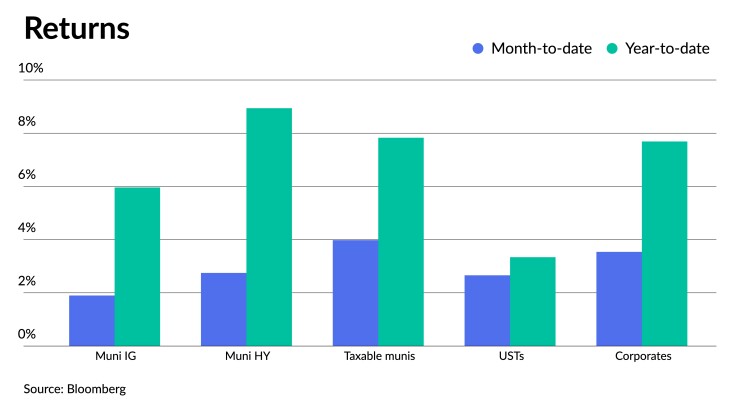
The Bloomberg Municipal Index has returned 1.90% so far in December and 5.96% year-to-date, while the High-Yield Index is up 2.75% this month and 8.94% in 2023. Taxable munis are returning 3.98% in December bringing year-to-date returns to 7.83%.
The $36 billion of reinvestment money that came into the market on Dec. 1 is still being deployed by investors, with another $32 billion expected at the start of the year, they said.
The new-issue calendar should be “very low” for the next several weeks due to the holidays, they noted.
However, the light issuance will be greeted with “solid demand,” said Jeff Lipton, managing director of credit research at Oppenheimer Inc.
“Actions and comments surrounding last week’s [Federal Open Market Committee] meeting have been directionally supportive of muni bond prices and we view this as a harbinger of favorable things to come in early 2024,” he said.
The last quarter of 2023 reversed what was “likely going to be another year of fixed income losses thanks to a shift in monetary policy sentiment,” Lipton said.
Munis are returning 5.96% year-to-date and 1.90% month-to-date, while USTs are returning 3.34% so far this year and 2.66% through Monday.
With muni yields spending much of the year under upward pressure, he said “attractive cash-flows created a strong ‘carry’ component to performance, providing an offset to principal losses as well as defensive portfolio attributes,” he said.
These cash flows will likely extend into 2024, but with less price erosion, according to Lipton.
Munis have historically “outperformed high-grade debt instruments during periods of rising interest rates, and 2023 has partially followed this trend with tax-exempts outperforming UST, yet underperforming corporates” that have seen a year-to-date return of 7.69%, he said.
“November was an extremely good month for fixed income performance as the bond markets seemingly made peace with Fed policy and the directional path of inflation,” he said.
Despite fixed income displaying positive returns month-to-date leading into the extended Christmas holiday weekend, he said “munis were underperforming both UST and corporates as bonds rallied.”
If not for constructive technical conditions in the muni market, Lipton said “the performance gap between munis and UST/Corps would have likely been wider.”
Sustained favorable technicals throughout most of the year were largely accretive to performance and “munis can be expected to outperform UST with ‘net negative supply’ potentially extending this outperformance, yet such anticipated outperformance may be challenged given what we expect to be a march towards looser monetary policy with a higher probability of intermittent rallies,” he said.
Fund flows may turn, at the very least, “intermittently positive as demand for product accelerates into 2024,” he said.
Lipton anticipates a “conventional ‘January Effect’ for 2024 with ample reinvestment needs resulting in net negative supply of about $11.4 billion over the next 30 days, according to Bloomberg data.”
As the end of 2023 approaches, the muni market is in a favorable technical spot, said AllianceBernstein strategists in a weekly report.
This should continue to “bode well” for muni bond investors, they said.
With less than two weeks remaining for the year, new-issue supply is “basically nonexistent,” providing a tailwind to the muni market that should remain in place through January, they said.
This lack of supply “will be met with sizable coupon payments in January,” AllianceBernstein strategists said.
“In addition, as investors (hopefully) take note of the incredibly strong returns over the last several weeks, we would expect demand to start to materialize in the municipal market,” they noted.
January tends to be a “very strong” month in the muni market, with the strong performance being dubbed the “January Effect.”
Over the past 15 years, they said the average return of the Index in January has been 0.93%. “Investors sitting in T-bills or cash should be aware that those investments have materially underperformed muni bonds,” they said.
Secondary trading
Washington 5s of 2024 at 3.51%. California 5s of 2024 at 2.76%. DC 5s of 2025 at 2.67%.
Massachusetts 5s of 2028 at 2.34%. Washington 5s of 2029 at 2.36% versus 2.65%-2.62% original on 12/4. NYC TFA 5s of 2029 at 2.39%-2.37%.
NYC 5s of 2033 at 2.46%-2.45%. Tennessee 5s of 2034 at 2.37%-2.34%. NY State Urban Development Corp. 5s of 2036 at 2.64% versus 2.67%-2.66% Monday and 2.75% original on Friday.
San Diego County 5s of 2048 at 3.45% versus 3.54%-3.53% Monday and 3.63%-3.64% Thursday. Massachusetts 5s of 2053 at 3.79% versus 4.00% Friday and 3.90%-3.87% Thursday.
AAA scales
Refinitiv MMD’s scale was bumped up to three basis points: The one-year was at 2.71% (unch) and 2.56% (unch) in two years. The five-year was at 2.31% (unch), the 10-year at 2.31% (-2) and the 30-year at 3.50% (-3) at 3 p.m.
The ICE AAA yield curve was bumped up to three basis points: 2.75% (unch) in 2024 and 2.57% (-2) in 2025. The five-year was at 2.30% (-2), the 10-year was at 2.34% (-2) and the 30-year was at 3.50% (unch) at 4 p.m.
The S&P Global Market Intelligence municipal curve saw bumps five years and out: The one-year was at 2.71% (unch) in 2024 and 2.58% (unch) in 2025. The five-year was at 2.34% (-3), the 10-year was at 2.40% (-7) and the 30-year yield was at 3.46% (-2), according to a 3 p.m. read.
Bloomberg BVAL was bumped up to a basis point: 2.60% (unch) in 2024 and 2.52% (unch) in 2025. The five-year at 2.23% (-1), the 10-year at 2.31% (-1) and the 30-year at 3.40% (-1) at 4 p.m.
Treasuries were slightly firmer.
The two-year UST was yielding 4.436% (-2), the three-year was at 4.143% (-1), the five-year at 3.937% (-1), the 10-year at 3.925% (-2), the 20-year at 4.218% (-2) and the 30-year Treasury was yielding 4.037% (-2) near the close.