Municipals were slightly firmer Thursday as the last of the week’s large new-issues came and went while U.S. Treasuries were little changed and equities ended up ahead of Friday’s much-anticipated jobs report.
Triple-A yields fell one to three basis points while USTs yields were relatively flat, only a basis point down out long.
Relative value continues to fall for munis as the two-year muni-to-Treasury ratio Thursday was at 59%, the three-year at 60%, the five-year at 60%, the 10-year at 61% and the 30-year at 87%, according to Refinitiv Municipal Market Data’s 3 p.m., ET, read. ICE Data Services had the two-year at 59%, the three-year at 59%, the five-year at 59%, the 10-year at 62% and the 30-year at 87% at 4 p.m.
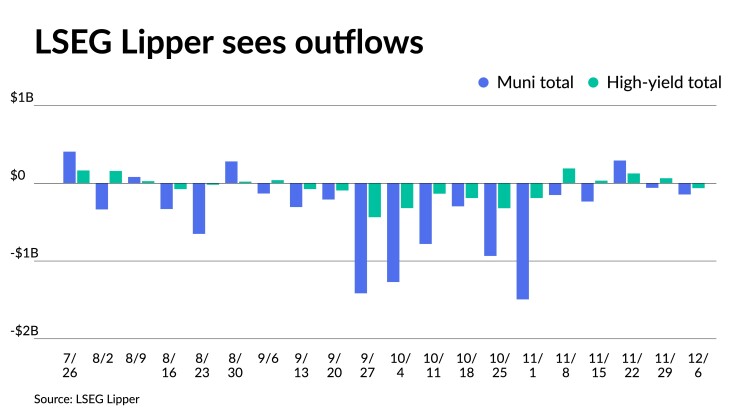
LSEG Lipper reported Thursday that investors pulled $144.5 million from muni mutual funds for the week ending Wednesday after outflows of $58.9 million the week prior.
High-yield saw outflows of $6.3 million after inflows of $64.8 million the week prior.
The municipal market was firm on Thursday, still showing signs of the strength from the mid-November rally, based on the strong technicals, according to a New York trader.
The imbalance of supply and demand is what is keeping the market firm, he said on Thursday just before market close.
“The market is very firm and only losing a little steam,” he said. The yield curve remains inverted on the short end, while it is flat and steepens a little past 10 years, he said.
“Munis continue to outperform Treasuries and I don’t see anything to slow them down, except for a burst of supply — and I don’t see that on the horizon,” he said.
The lack of supply is having a big impact on the market — as is the arrival of the upcoming Federal Open Market Committee meeting next week, according to the trader.
In addition, investors and issuers are avoiding participating in the market next week, even though the Fed is expected to stand pat for now, he said.
“That means the calendar is going to dry up into year-end, but it also means the market is going to continue to do pretty well in here until we get into January and get some meaningful supply back into the marketplace,” he said.
“The week before Christmas will be dead,” he added. “There will be no deals pricing and not much of a calendar.”
New issuance and trading should start to slow after the Fed meeting — especially heading into the week before the Christmas and New Year’s holidays, according to the trader.
There is no urgency for issuers to price deals, and many are waiting until January for the expected lower rate climate, he continued.
“If you don’t have to come to the market, then issuers aren’t planning to sell because I think we are heading lower in the New Year,” the trader said.
“There’s no rush,” he added. “It’s not like they’re going to miss an opportunity.”
Secondary trading
Ohio 5s of 2024 at 2.96%. California 5s of 2024 at 2.92%. NYC 5s of 2025 at 2.75% versus 2.91%-2.89% on 11/30.
Maryland 5s of 2028 at 2.53% versus 2.55%-2.53% Wednesday. Boston 5s of 2028 at 2.36%. Connecticut 5s of 2029 at 2.55%.
NYC TFA 5s of 2031 at 2.58%. Garland ISD, Texas, 5s of 2033 at 2.65%-2.63% versus 2.75% original on Wednesday. Triborough Bridge and Tunnel Authority 5s of 2034 at 2.63%-2.59%.
Washington 5s of 2047 at 3.77%-3.75%. Massachusetts 5s of 2053 at 4.06%-4.05% versus 3.99%-3.80% Friday and 4.15%-4.12% on 11/29
AAA scales
Refinitiv MMD’s scale was bumped up to three basis points: The one-year was at 2.92% (-2) and 2.72% (-2) in two years. The five-year was at 2.47% (-2), the 10-year at 2.50% (-3) and the 30-year at 3.71% (unch) at 3 p.m.
The ICE AAA yield curve was bumped one to two basis points: 2.90% (-1) in 2024 and 2.73% (-1) in 2025. The five-year was at 2.47% (-1), the 10-year was at 2.55% (-1) and the 30-year was at 3.67% (-2) at 4 p.m.
The S&P Global Market Intelligence municipal curve was bumped two basis points: The one-year was at 2.88% (-2) in 2024 and 2.75% (-2) in 2025. The five-year was at 2.54% (-2), the 10-year was at 2.63% (-2) and the 30-year yield was at 3.65% (-2), according to a 3 p.m. read.
Bloomberg BVAL was bumped one to three basis points: 2.79% (-1) in 2024 and 2.71% (-2) in 2025. The five-year at 2.44% (-2), the 10-year at 2.52% (-3) and the 30-year at 3.59% (-3) at 4 p.m.
Treasuries were little changed.
The two-year UST was yielding 4.585% (-2), the three-year was at 4.331% (-1), the five-year at 4.118% (flat), the 10-year at 4.135% (+1), the 20-year at 4.421% (+1) and the 30-year Treasury was yielding 4.248% (+1) at near the close
Muni performance
Most of what is happening in the muni market today is predicated by what’s happening with the economy, inflation and the Fed, said Erik Aarts, senior fixed income strategist at Touchstone Investments.
On the economic front, the municipal marketplace came into this environment in 2023 in fairly decent shape due to state and local municipalities’ good tax revenue growth and rainy day funds, which have been at least until recently fully funded, he said.
That, he said, was “very supportive” of the asset class.
However, with inflation rising as much as it has, he said there are concerns about interest rates and where they’re headed, which has weighed on the asset class. This was significantly worse in 2022 heading into 2023, Aarts said.
Munis saw positive returns early in the year as the market snapped back, but over the summer and into the fall muni returns turned negative. However, November’s impressive performance, which saw munis returning 6.35% for the month, pushed returns into positive territory for the year. Munis are returning 4.67% year-to-date.
Market movements in the muni market from 2022 into 2023 can be characterized as a “major reset,” according to Aarts.
Muni yields moved higher than 4%, which on a tax equivalent basis makes them “quite attractive.”
Therefore, he said, it’s not surprising that yields have come down.
The muni market has seen a weekslong rally, with triple-A benchmarks falling up to 108 basis points since the start of November.
However, Aarts said this prolonged rally.
“We’ve seen the markets want to lean into the idea” that the Fed will achieve a soft landing, he said.
Over the summer through October, “there were a lot of signs that perhaps the Fed was going to be higher for longer and … that’s only to be reversed right at the end of October with a better payroll report at the beginning in November, a little bit better CPI inflation print coming in and the Fed holding rates at their early November meeting,” he said.
There may be some volatility for the remainder of the year as “the market tries to negotiate this period of ‘higher for longer,'” he said.
“As we move into the last part of the year, we’re going to be waiting and seeing what the data is going to say,” he said.
Upcoming data includes Friday’s jobs report and next Monday’s CPI report, along with next week’s FOMC meeting.
There could also be more volatility due to many market participants, who had been sitting on the sidelines, coming to the market to wrap things up for the year.
Primary on Wednesday
Morgan Stanley priced for Hawaii (Aa2/AA+/AA/) $750 million of taxable GOs, 2023 Series GM, with 5.331s of 4/2024 at par, 5s of 10/2028 at 4.519%, 4.841s of 10/2033 at par, 5.321s of 10/2038 at par and 5.418s of 10/2042 at par, callable 10/1/2033.
Christine Albano contributed to this story.